Audit
Deprecation notice
Support for the audit page has been deprecated. Instead, pull audit logs from Kubernetes and push them to your SIEM.
All activity in Immuta is audited. This process provides rich audit logs that detail who subscribes to each data source, why they subscribe, when they access data, what SQL queries and blob fetches they run, and which files they access. Audit logs can be used for a number of intentions, including insider threat surveillance and data access monitoring for billing purposes. Audit logs can also be shipped to your enterprise auditing capability.
For more details about using audit logs, see the Audit Logs User Guide.
Audit Log Transport Details
Immuta's logging system is designed to easily connect with enterprise log collection and aggregation systems. Please see the Immuta System Audit Logs page for full details.
Audit UI Functionality
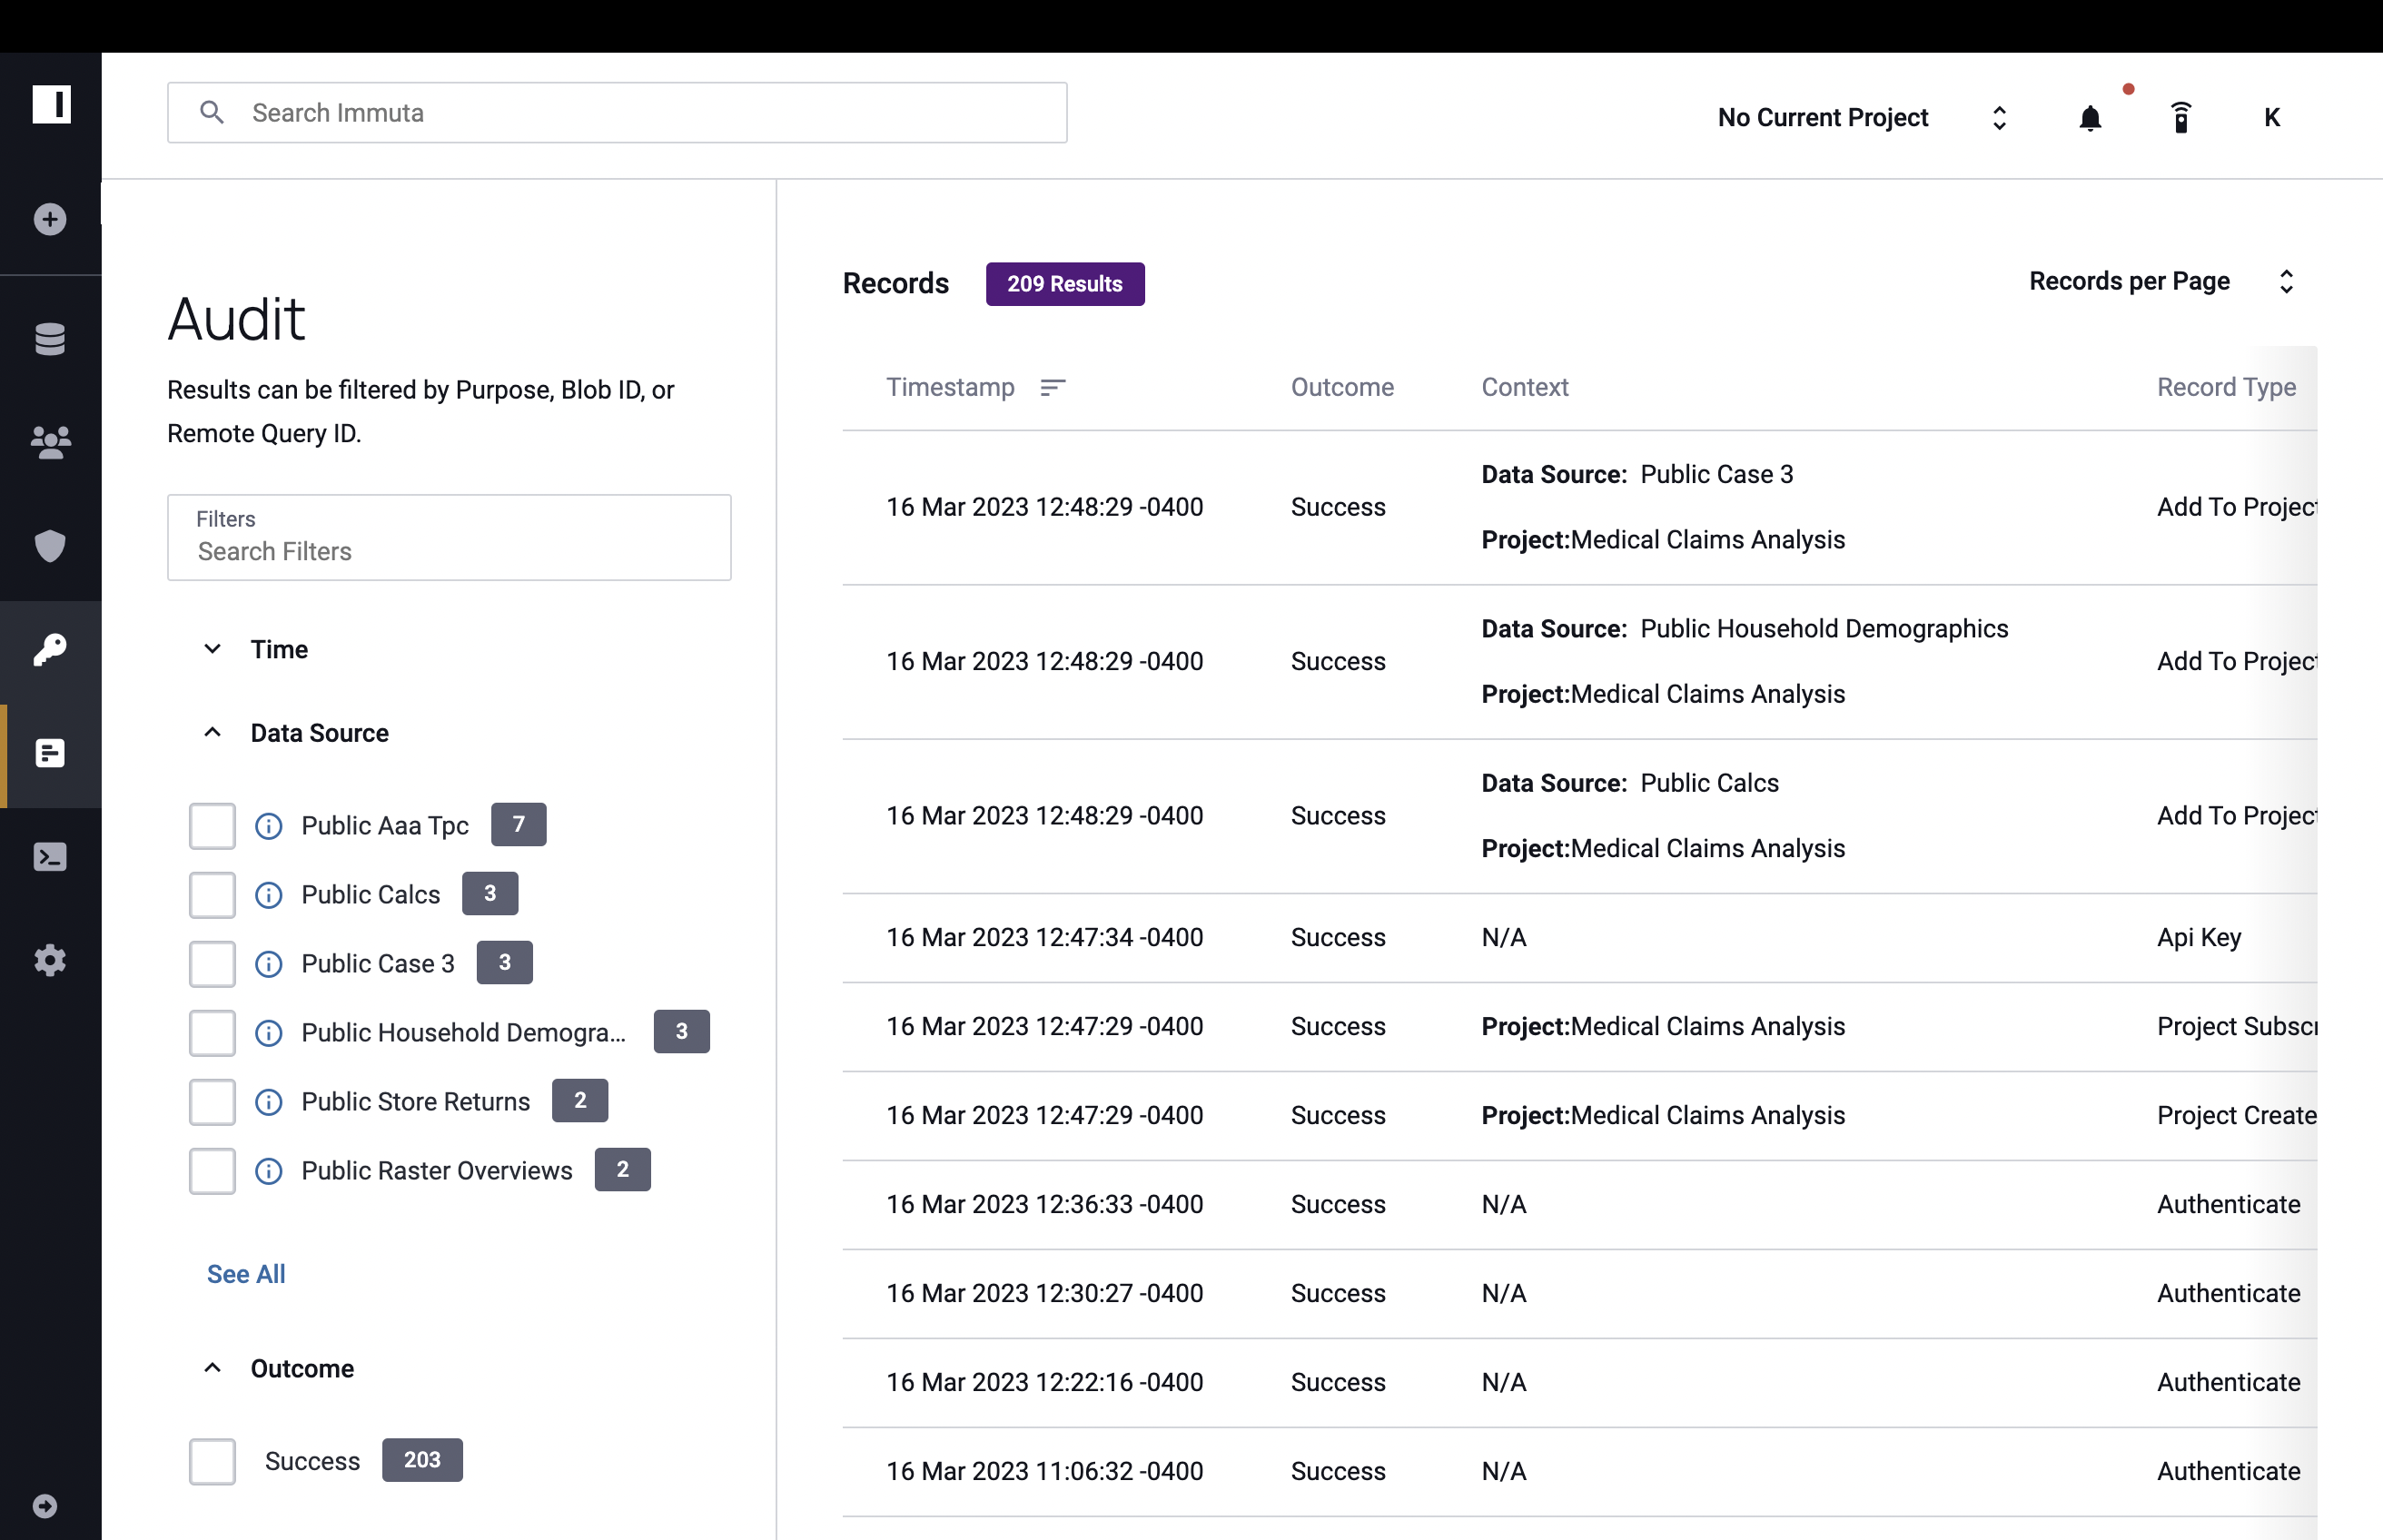
Immuta provides access to all of the audit logs via the Audit page.
Only users with the
AUDIT permission can access this page. See the
Administration section
for more information.
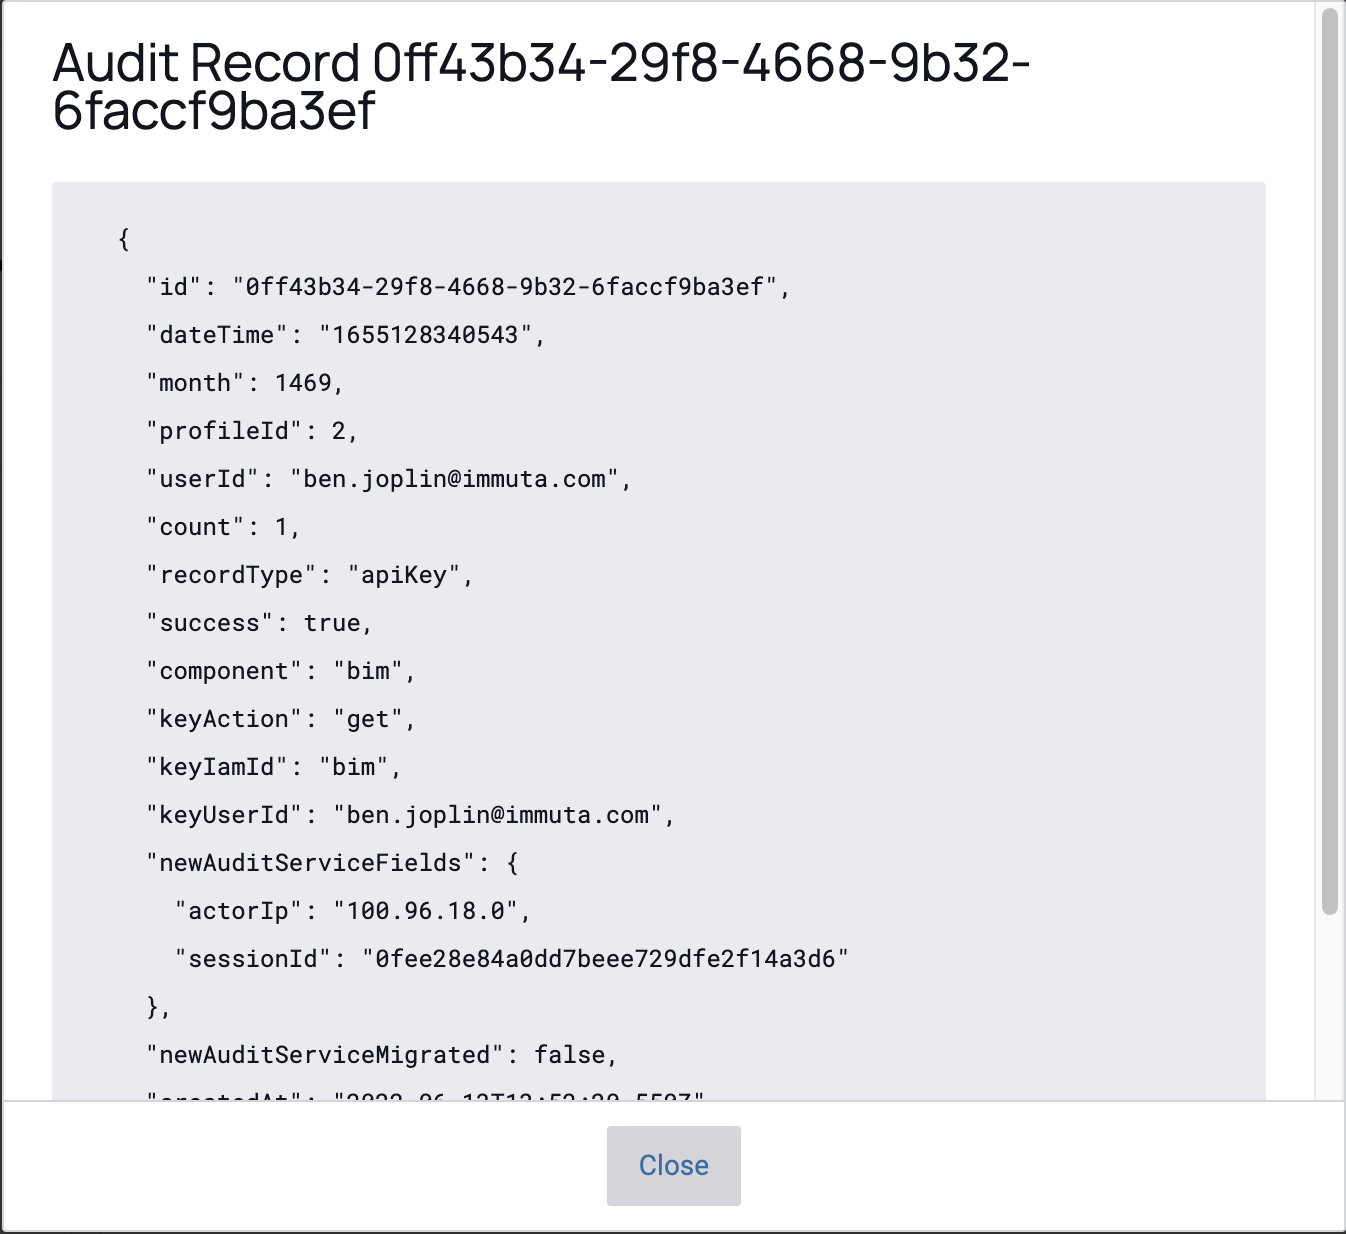
Users can sort these logs by ascending (oldest entries first) or descending (latest entries first) order. By default, 50 log entries are displayed to a page, but that can be changed to 100 or 200. Additionally, users can filter the entries in a variety of ways, including by project purpose, blobId, remote query id, the entry timestamp, data source, project, record type, user, and SQL query. These query audit records detail the query run, the columns that were masked, and how the masking was enforced.